


Most people grab a skincare dataset, run a few filters, and call it analysis.
They miss 90% of what’s actually there.
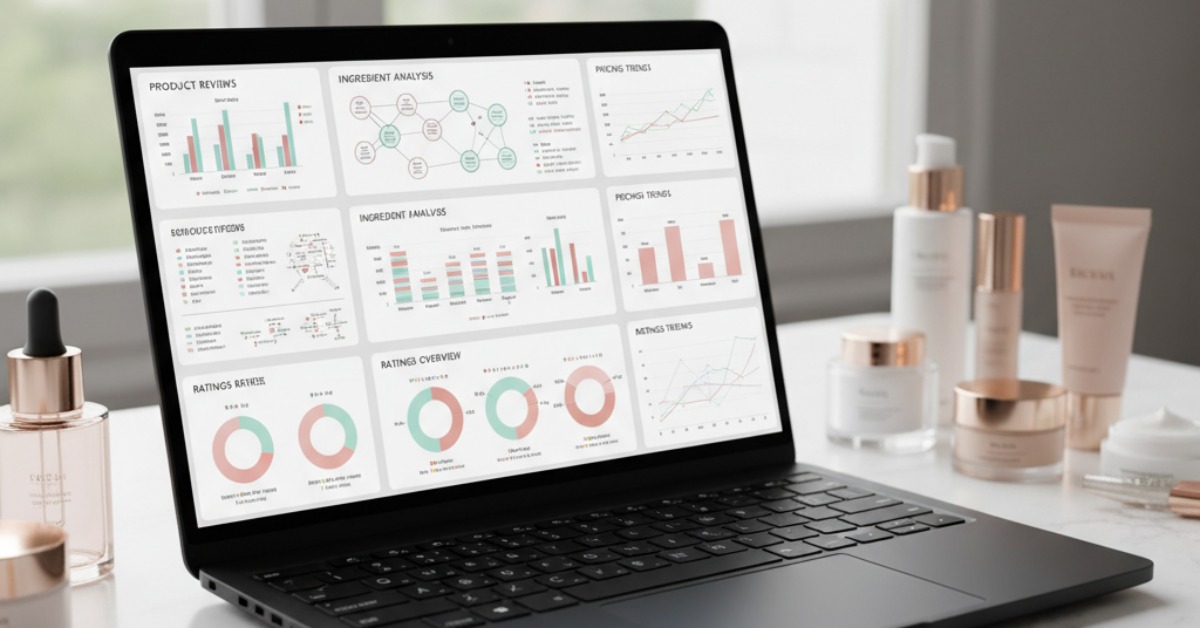
A well-structured skincare products dataset is one of the most underrated sources of market intelligence available right now. It tells you what brands are betting on, what ingredients are trending before consumers even notice, and where pricing strategy breaks down.
Here’s what you can actually extract from it, if you know where to look.
1. Ingredient Frequency Reveals Formulation Trends Before They Go Mainstream
Run a simple frequency count on the ingredients column.
You’ll see which actives are appearing across new SKUs. Niacinamide dominated the early 2020s. Peptides are the current climb. Bakuchiol started appearing in niche SKUs 18 months before mainstream brands picked it up.
This is a leading indicator, not a lagging one. Brands formulate 12–24 months before launch. The dataset shows you where R&D budgets are going right now.
2. Price Distribution Exposes Positioning Gaps in the Market
Plot the price distribution across categories (moisturizers, serums, SPF, etc.).
You’ll almost always find a dead zone between mass-market and premium. That’s the gap most challenger brands aim for, and it’s where the dataset tells you whether the space is crowded or wide open.
- Cluster pricing at $15–$25 and $80+? Mid-market is underserved.
- Dense distribution at $35–$55? That segment is saturated.
Use this before building a product, not after.
3. Skin Type Targeting Shows Which Audiences Are Over-Served or Ignored
Tag each product by its intended skin type (oily, dry, sensitive, combination, all skin types).
Count the SKUs per segment. In most datasets, “sensitive skin” products are dramatically under-represented compared to actual consumer demand data from search trends.
That mismatch is a business opportunity.
4. Brand SKU Count vs. Rating Score: The Quality-Scale Trade-Off
Here’s a counter-intuitive insight most analysts miss.
Brands with the most SKUs rarely have the highest average ratings. Over-expansion dilutes formulation quality, splits R&D spend, and confuses the consumer. Small-catalog brands with 8–15 SKUs often score significantly higher.
Build a scatter plot of SKU count vs. average rating. Brands sitting in the top-left quadrant (few SKUs, high ratings) are either acquired targets or future disruptors.
5. SPF Claims as a Proxy for Regulatory Sophistication
Filter for any product with an SPF claim. Now look at how that claim is described.
Some brands say “SPF 30.” Others say “Broad Spectrum SPF 30 PA+++.” That difference tells you a lot. Brands using PA+++ ratings are formulating for Asian markets or positioning for an Asian consumer base, where UVA protection is taken more seriously.
It’s a data signal about market strategy, not just formulation.
6. Product Name Patterns Reveal Copywriting and Positioning Frameworks
This one gets overlooked entirely.
Extract product names and run basic NLP or even a manual content audit. You’ll find recurring patterns: numbers (“10% Niacinamide”), outcomes (“Brightening,” “Barrier Repair”), ingredient-first naming, or brand-first naming.
Outcome-led naming correlates strongly with DTC brands. Ingredient-led naming correlates with brands targeting informed consumers and professionals.
If you’re a product team, this tells you how your competitors want to be perceived.
7. Category Saturation Analysis for New Product Development
Count the number of products per category. Then cross-reference with average rating and average price.
Categories with high product count + low average rating = formulation failure at scale. That’s either a hard problem to solve, or a massive opening for a brand that gets it right.
Serums are a classic example. Crowded category, highly variable ratings, wide price range. Brands that win there do so with very specific targeting (ingredient + concern + skin type), not by making “a serum.”
8. Cruelty-Free and Clean Beauty Tags as Market Positioning Data
If your dataset includes labels like “cruelty-free,” “vegan,” “clean,” or “fragrance-free,” don’t ignore them.
Map these tags against price point and rating. You’ll typically find:
- Cruelty-free products cluster in the mid-to-premium tier.
- “Clean” claims are inconsistently applied across brands, which signals a lack of standardization (and a trust gap consumers are increasingly aware of).
- Fragrance-free products have statistically higher ratings in skincare vs. fragrance-inclusive equivalents.
For developers building recommendation systems, these tags should be weighted differently based on skin concern, not just user preference.
9. Review Volume vs. Review Score: The Hype Detector
High rating + low review count = promising but unproven. High rating + high review count = genuinely strong product. Low rating + high review count = known problem. Likely still selling on distribution, not merit.
This three-way segmentation separates hype from substance. It’s the fastest way to quality-filter a large dataset for product benchmarking, competitor analysis, or building a training dataset for a recommendation engine.
10. The Dataset Is a Mirror of Consumer Trust. Not Just Product Data.
Here’s the insight that changes how you use this data.
A skincare products dataset doesn’t just describe products. It reflects what consumers were willing to buy, review, and recommend. Every data point in it is the output of a decision a real person made with their own money.
That means patterns in the data are patterns in consumer psychology. Pricing clusters aren’t just pricing strategies. They’re what people believe certain categories are worth. Ingredient trends aren’t just R&D choices. They’re responses to real consumer concerns.
If you’re building with this data, you’re not working with product specs. You’re working with behavioral signals.
How to Start Extracting These Insights Right Now
You don’t need a complex stack. Start with:
- A clean skincare products dataset (Beauty Feeds has several well-structured ones).
- Python (pandas + matplotlib) or even Excel for initial exploration.
- A clear business question before you open the file.
The last point matters more than the tools. Analysts who open datasets without a question end up with dashboards. Analysts who open them with a hypothesis end up with answers.
Final Word
A skincare products dataset is only as valuable as the questions you bring to it.
The 10 insights above are starting points, not endpoints. Each one can be taken three levels deeper depending on your use case, whether you’re a developer building a rec system, an analyst benchmarking competitors, a student working on a portfolio project, or a product team making a launch decision.